This tutorial follows one complete run: eight product priorities, a balanced MaxDiff design, six EDSL agents, human and model fielding routes, and a pooled Bradley–Terry estimate.
The commands and outputs below were captured from the study in examples/maxdiff-roadmap. The small synthetic panel demonstrates the workflow; it is not evidence about a real customer population.
1. Initialize a MaxDiff study
--type maxdiff changes Green’s definition and analysis vocabulary from attributes and profiles to items and best–worst tasks.
green--project-dir examples/maxdiff-roadmap init --type maxdiff \
--description"Priorities for an AI research and survey platform"
Every item appears exactly ten times across the design. Each pair appears together three to five times. The saved seed makes the 80 design rows reproducible.
5. Build native EDSL packages
green--project-dir examples/maxdiff-roadmap field build \
--design main --job-name roadmap_piped --agent-list panel \
--output-dir examples/maxdiff-roadmap
The files are native, git-backed EDSL objects rather than generated Python. Green also writes the mapping used to normalize EDSL answers back into item-level response rows.
The worst question pipes in the answer to the best question:
Which item is best?
You selected {{ best_v1_t1.answer }} as best.
Which different item is worst?
Do not select the item you chose as best.
The reference makes EDSL administer the best question first and puts its answer into the follow-up prompt.
6. Inspect agents, questions, and cost before execution
ep inspect examples/maxdiff-roadmap/jobs.ep
ep inspect examples/maxdiff-roadmap/agent_list.ep
ep surveys questions examples/maxdiff-roadmap/survey.ep
ep jobs cost examples/maxdiff-roadmap/jobs.ep --model gpt-5.4-mini
green plan field --design main --job-name roadmap_piped
Execution boundary. Building, inspecting, and pricing the package are local or read-only actions. The following ep run was executed only after the user reviewed and approved the plan.
ep run examples/maxdiff-roadmap/jobs.ep --model gpt-5.4-mini \
--output examples/maxdiff-roadmap/results.ep
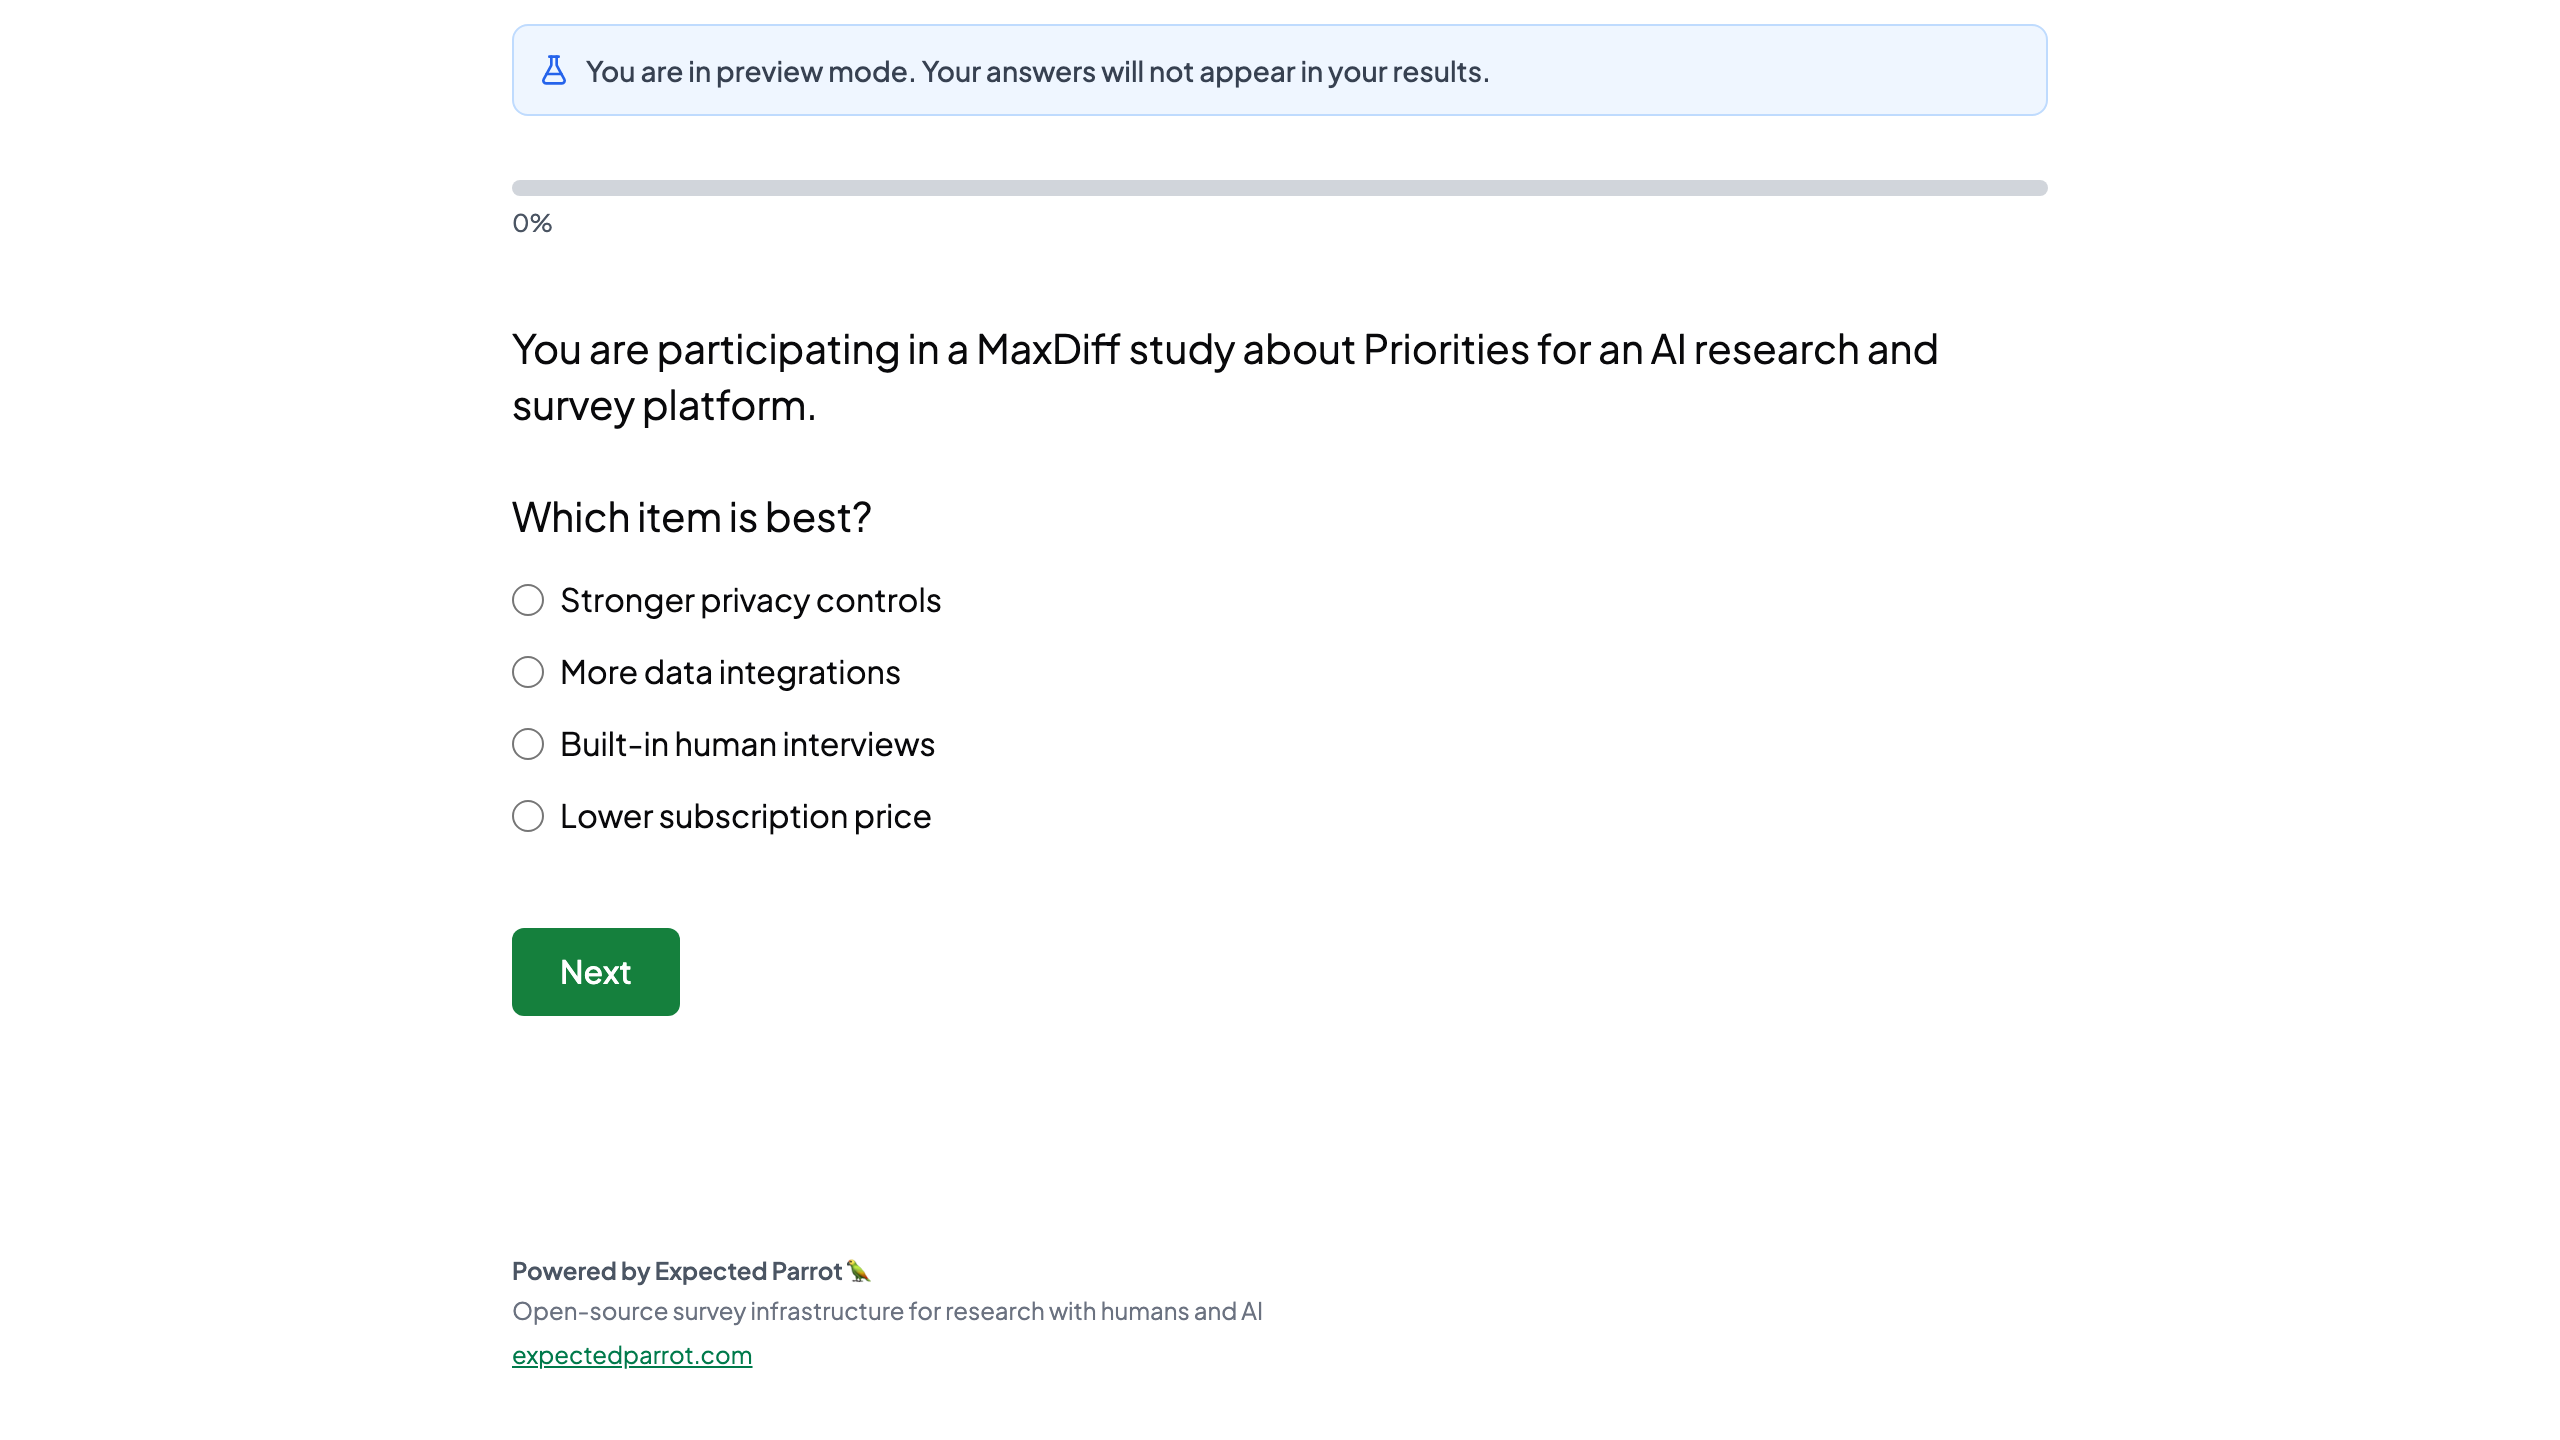
Humanize renders the saved Survey as a respondent-facing web study. Preview mode does not save answers; the created survey has a durable UUID and respondent URL.
ep humanize preview \
--survey examples/maxdiff-roadmap/survey.ep \
--schema examples/maxdiff-roadmap/humanize-schema.json
ep humanize create \
--survey examples/maxdiff-roadmap/survey.ep \
--schema examples/maxdiff-roadmap/humanize-schema.json \
--name"Green MaxDiff roadmap tutorial"green field register roadmap_piped \
--human-survey a49f8dde-e9a6-4cf9-bf97-a57fa826f9dd
The live respondent preview. The next screen pipes the selected best item into the worst-choice question and instructs the respondent to choose a different item.
After human fielding, fetch a typed Results package and import it through the same Green contract used for model responses:
ep humanize responses a49f8dde-e9a6-4cf9-bf97-a57fa826f9dd \
--output examples/maxdiff-roadmap/human-results.ep
green data import-edsl examples/maxdiff-roadmap/human-results.ep \
--design main --job-name roadmap_piped --name human_field_run
No human responses were fabricated for this tutorial; the screenshot uses ?save_response=false.
8. Import model responses and inspect quality
green data import-edsl examples/maxdiff-roadmap/results.ep \
--design main --job-name roadmap_piped --name corrected_field_run
green data quality corrected_field_run
green next
All 120 respondent-tasks contain exactly one best item, exactly one worst item, and distinct selections. No task-level override or exclusion policy is needed.
9. Estimate the pooled model
green plan estimate --data corrected_field_run --method mnl \
--name roadmap_maxdiff
green estimate mnl --data corrected_field_run --name roadmap_maxdiff
Green converts each best–worst answer into five implied pairwise wins and fits pooled, zero-centered Bradley–Terry utilities. Standard errors come from the optimizer’s covariance estimate.
10. Read the ranking
green report maxdiff roadmap_maxdiff
Show captured ranking
rank item utility SE
1 Stronger privacy controls 0.710 0.154
2 Easier study setup 0.493 0.161
3 Richer reports and exports 0.447 0.157
4 Faster analysis turnaround 0.427 0.159
5 More data integrations 0.157 0.157
6 Lower subscription price -0.370 0.150
7 Higher-quality synthetic panels -0.696 0.155
8 Built-in human interviews -1.169 0.166
Intervals describe uncertainty in each item’s utility relative to the zero-centered scale. Overlap is a warning against over-reading adjacent ranks; a formal contrast requires the covariance between item estimates.
The utility plot is the statistically faithful view. For a planning conversation, the same estimates can be exponentiated and normalized into relative preference shares that sum to 100 percent:
Priority
Preference share
Best − worst count
Stronger privacy controls
21.6%
+21
Easier study setup
17.4%
+13
Richer reports and exports
16.6%
+12
Faster analysis turnaround
16.2%
+11
More data integrations
12.4%
+4
Lower subscription price
7.3%
−10
Higher-quality synthetic panels
5.3%
−19
Built-in human interviews
3.3%
−32
How to present this to a decision-maker. Use preference shares for relative allocation and the dot-and-whisker plot for uncertainty. Call them model-derived priority shares, not respondent percentages or forecast market shares. The best-minus-worst counts are an intuitive descriptive check, while the MNL utilities are the inferential result.
The utilities are relative and sum to zero. In this demonstration panel, privacy leads; setup, exports, and analysis speed form a less clearly separated second group. With only six synthetic personas, the result shows that the pipeline works—not what a market believes.
For heterogeneity, the same normalized responses also support respondent-level shrinkage and latent preference classes:
green estimate hb --data corrected_field_run --name roadmap_hb \
--iterations 1000 --seed 42
green estimate latent-class --data corrected_field_run \
--name roadmap_classes --classes auto --seed 42
The empirical-Bayes estimator shrinks each respondent’s item utilities toward the pooled result. The latent-class estimator selects among one to four Bradley–Terry mixtures by BIC and saves class membership probabilities. With six example personas, these are workflow demonstrations rather than credible segmentation.
Persist the decision view, its structured data, provenance, and plot together:
green report save --name roadmap_decision \
--kind maxdiff --input roadmap_maxdiff
The concise audit record is checked in as results-summary.json. Green’s durable provenance is under .green/; this tutorial places public EDSL objects and Results explicitly under examples/maxdiff-roadmap/.