Green · worked price-sensitivity study
Map the acceptable price range for a meal box.
This tutorial exposes every input behind the four Van Westendorp curves: what product respondents evaluate, who answers, the exact numerical questions, how malformed thresholds are handled, and how Green locates PMC, PME, OPP, and IPP.
Van Westendorp is a stated-perception method. It does not estimate a demand curve or prove a profit-maximizing price. Here it provides a price window to investigate for a weekly meal box.
1. State the pricing decision
green init --type van-westendorp \
  --description "Exploring the acceptable weekly price for a meal subscription serving two people"
green next
Show the next action
{
  "phase": "definition-empty",
  "action": {
    "command": "green product describe product --description 'Product being priced'"
  }
}
The project description becomes visible study context in the generated Survey. It is not supplied later by an execution wrapper.
2. Define the product respondents will price
green product describe weekly_box \
  --description "A box delivered weekly with ingredients and recipes for three dinners, serving two people" \
  --unit USD
green product show
green validate
Show persisted product state
{
  "product": {
    "name": "weekly_box",
    "description": "A box delivered weekly with ingredients and recipes for three dinners, serving two people",
    "unit": "USD"
  },
  "study_context": "Exploring the acceptable weekly price for a meal subscription serving two people"
}
Green renders the stable ID as “weekly box,” includes the complete description and study context in every question, and tells respondents to enter prices in USD.
3. Define respondents explicitly
Green does not synthesize a population from the phrase “meal-kit shoppers.” Each model agent below is an intentional record with a persona and structured traits.
green agent-list create panel

green agent add panel --id budget_parent \
  --persona "Budget-conscious parent comparing meal kits with grocery shopping" \
  --trait household=family --trait price_sensitivity=high

green agent add panel --id busy_couple \
  --persona "Dual-income couple paying for weeknight convenience" \
  --trait household=couple --trait price_sensitivity=medium

green agent add panel --id current_subscriber \
  --persona "Current meal-kit subscriber familiar with portions and delivery quality" \
  --trait meal_kit_experience=current

green agent add panel --id former_subscriber \
  --persona "Former subscriber who cancelled because the service became too expensive" \
  --trait meal_kit_experience=former --trait price_sensitivity=high

green agent-list show panel
Show the resulting EDSL trait contract
Agent(
  name="former_subscriber",
  traits={
    "persona": "Former subscriber who cancelled because the service became too expensive",
    "meal_kit_experience": "former",
    "price_sensitivity": "high",
    "green_respondent_id": "former_subscriber"
  }
)
Four agents demonstrate mechanics; they are not a defensible market sample. For human fielding, the Survey is administered to recruited respondents and these synthetic personas need not define the sample.
4. Build the native fielding packages
green field build --job-name pricing --agent-list panelShow exact public outputs
./survey.ep
./agent_list.ep
./jobs.ep
./question-map.json
./humanize-schema.json
./manifest.json
Public artifacts go to cwd by default. Use --output-dir fielding/pricing when you deliberately want another location. Green keeps an immutable provenance copy under .green/generated/, but subsequent ep commands use the public paths returned above.
5. Inspect the actual agents and questions
ep inspect jobs.ep
ep inspect agent_list.ep
ep surveys questions survey.ep
Show the fielded question text
too_cheap · numerical
  Product: weekly box
  Description: A box delivered weekly with ingredients and recipes
               for three dinners, serving two people
  Study context: Exploring the acceptable weekly price for a meal
                 subscription serving two people

  At what price would this product be so inexpensive that you would
  question its quality?

  Enter a price in USD.

bargain · numerical
  At what price would this product be a bargain—a great buy for the money?

expensive · numerical
  At what price would this product start to seem expensive,
  but still be worth considering?

too_expensive · numerical
  At what price would this product be too expensive to consider?
The four labels are stable analysis fields. Their wording, product context, response unit, agent traits, and absence of an embedded model are all reviewable before execution.
6. Review fielding burden and choose administration
ep jobs cost jobs.ep --model gpt-5.4-mini
green plan field --job-name pricing
Show plan arithmetic
respondents          4
questions each       4
external model calls 16
requires approval    true
expected output      results.ep
For an approved synthetic-agent run:
# Only after explicit approval
ep run jobs.ep --model gpt-5.4-mini --output results.ep
For human respondents, use the reviewed Survey directly:
ep humanize preview --survey survey.ep
ep humanize create --survey survey.ep \
--schema humanize-schema.json --name "Weekly meal-box price study"7. Normalize returned EDSL or Humanize results
green data import-edsl results.ep \
  --job-name pricing --name field_run_1
green data quality field_run_1
Show one normalized respondent
respondent_id,too_cheap,bargain,expensive,too_expensive
budget_parent,12,20,38,55
question-map.json binds each EDSL answer to its canonical threshold field. Agent traits remain provenance; Green does not infer or overwrite a respondent’s thresholds.
8. Run the same analysis on the checked-in fixture
green data import-vw examples/van-westendorp/responses.csv --name price_meter
green data quality price_meter
green report van-westendorp price_meter
Show the input contract
respondent_id,too_cheap,bargain,expensive,too_expensive
r1,12,20,38,55
r2,15,24,40,60
r3,10,18,35,50
… 8 respondents total
The fixture is observed-format data for reproducible analysis. Its respondent IDs are not claimed to be the illustrative agents above.
9. Check threshold ordering before intersections
required respondent-level order:

too_cheap ≤ bargain ≤ expensive ≤ too_expensive
Show the quality result
{
  "valid": true,
  "n_response_rows": 8,
  "warnings": [],
  "inversions": 0
}
An inversion is preserved and reported as a warning; Green does not silently sort a respondent’s answers. The report includes the inversion count and rate so the analyst can decide whether wording, respondent comprehension, or exclusion policy needs review.
10. See how the four points are calculated
Green evaluates empirical cumulative or reverse-cumulative proportions at every observed threshold and chooses the price with the smallest absolute gap between each named pair of curves.
Show curve pairs and meanings
PMC · point of marginal cheapness
  reverse CDF(too_cheap) = CDF(expensive)

PME · point of marginal expensiveness
  reverse CDF(bargain) = CDF(too_expensive)

OPP · optimal price point in Van Westendorp terminology
  reverse CDF(too_cheap) = CDF(too_expensive)

IPP · indifference price point
  reverse CDF(bargain) = CDF(expensive)
“Optimal” is the method’s conventional label for the OPP intersection. It is not an economic optimum and does not use costs, conversion, competitors, or willingness-to-pay demand.
11. Interpret and preserve the result
green report save --name price_window \
  --kind van-westendorp --input price_meter
green report list
green validate --require-report van-westendorp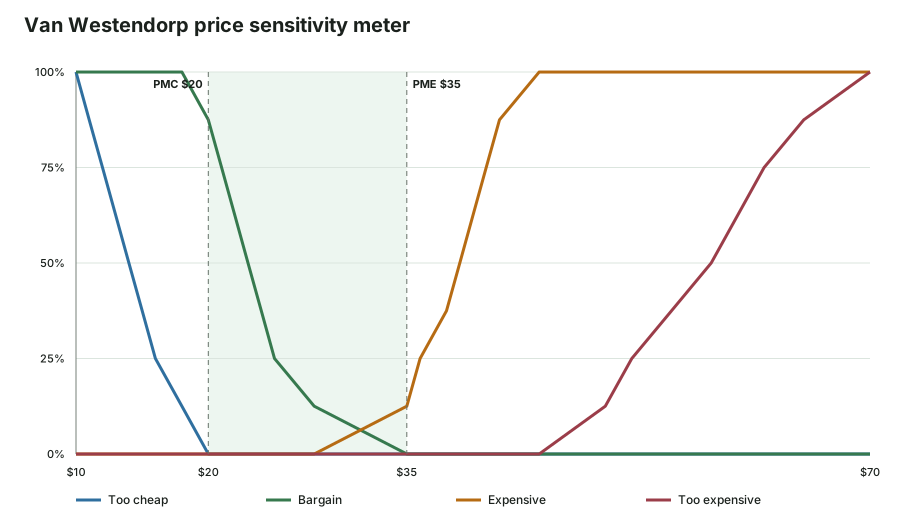
plot.svg generated from the checked-in eight-respondent fixture. The shaded $20–$35 band runs from PMC to PME; the four lines retain the empirical steps used to locate all intersections.Show the real example outcome
PMC  $20   point of marginal cheapness       gap 0.000
PME  $35   point of marginal expensiveness   gap 0.000
OPP  $20   conventional optimal price point  gap 0.000
IPP  $28   indifference price point           gap 0.125

acceptable range  $20–$35
inversions          0 of 8
The visual is the primary decision-facing representation; the collapsible values preserve exact intersections and gaps for audit. The nonzero IPP gap matters because finite samples need not contain an exact crossing. Green also saves the underlying JSON, a readable report, standalone HTML, and data provenance.
The explicit data flow
product describe ─┐
agent add ────────┼─→ Green state ─→ survey.ep + agent_list.ep → jobs.ep
project context ──┘                                      │
                         reviewed model run or Humanize ──┘
                                                         ↓
                                                     results.ep
                                                         ↓
                         import → ordering quality → empirical curves
                                → intersections → saved decision report
If product wording, units, respondent assumptions, or question text are not visible in Green state and the inspected EDSL packages, they are not part of the study.